Much of what we know about the brain has been learned by recording the electrical activity of one neuron at a time with metal microelectrodes. If we have a theoretical framework in which interesting things happen through collective activity in the network, however, it is difficult to see how we could make progress without experimental methods for recording from many neurons simultaneously.4 Several groups were recording from pairs of neurons already in the 1960s, but systematic efforts to record from many neurons took until the 1980s.
我们对大脑的了解大多来自于使用金属微电极一次记录一个神经元的电活动。然而,如果我们拥有一个理论框架,其中有趣的现象是通过网络中的集体活动发生的,那么如果没有同时记录许多神经元的实验方法,我们很难看到如何取得进展。几个研究小组在 20 世纪 60 年代已经开始记录成对神经元的活动,但系统地记录许多神经元的努力直到80年代才开始。
For five decades we saw exponential growth in the number of neurons that can be monitored simultaneously with arrays of electrodes (Fig 3), with a doubling time of 7.4 ± 0.4 yr (Stevenson and Kording, 2011). Impressively, progress followed essentially the same pace over the last decade, so that ∼ 103 cells now are accessible almost routinely in many different brain areas and many different organisms; these developments are described in §§III.A and III.B. This century also brought a fundamentally new technique, with animals genetically engineered so that their neurons produce fluorescent proteins with fluorescence intensity modulated by electrical activity (§III.C); these methods are approaching ∼ 106 neurons (Demas et al., 2021; Manley et al., 2024). This progress creates new challenges for data analysis, but more deeply new opportunities for testing once speculative theories. These developments also have a beauty of their own that we hope to capture here.
在过去的五十年里,我们看到使用电极阵列同时监测的神经元数量呈指数增长(图3),其翻倍时间为7.4 ± 0.4年(Stevenson 和 Kording,2011)。令人印象深刻的是,在过去的十年中,进展基本上保持了同样的速度,因此现在在许多不同的大脑区域和许多不同的生物体中,几乎可以常规地访问约103个细胞;这些发展将在§§III.A和III.B中进行描述。本世纪还带来了一个根本性的全新技术,即通过基因工程改造动物,使其神经元产生荧光蛋白,其荧光强度受电活动调制(§III.C);这些方法正在接近约 106 个神经元(Demas 等人,2021;Manley 等人,2024)。这一进展为数据分析带来了新的挑战,但更深层次地说,也为测试曾经是推测的理论创造了新的机会。这些发展本身也具有一种美感,我们希望在这里捕捉到这一点。
Before we begin, note that as methods diversified, “recording from $N$ neurons” came to mean different things, so a simple plot of $N_{\text{max}}$ vs time doesn’t capture everything that is going on in these experiments. These features of the experiments matter for theory, so we try to provide a guide. We caution that we are theorists reviewing experimental developments, and references are meant to be illustrative rather than exhaustive.
在我们开始之前,请注意,随着方法的多样化,“记录 $N$ 个神经元”开始意味着不同的事情,因此简单地绘制 $N_{\text{max}}$ 与时间的关系图并不能捕捉到这些实验中发生的所有情况。这些实验的特征对于理论来说很重要,因此我们试图提供一个指南。我们提醒大家,我们是评论实验发展的理论家,参考文献旨在说明问题,而不是详尽无遗。
Electrode arrays
Rather studying neurons in an intact brain, one can culture the cells in a dish, allowing them to connect into a network. In ∼1980, it was appreciated that the culture dish could be instrumented with an array of electrodes, giving access to the electrical activity of many if not all of the neurons in such artificial networks (Pine and Gilbert, 1982). Most of the brain is 3D, so this doesn’t generalize, but the retina can be quite flat, at least locally. Placing a patch of a dissected retina onto an array of electrodes gives access to the “ganglion cells” that carry information from the eye to the brain and come together to form the optic nerve (Meister et al., 1994). Techniques progressed from recording a handful of cells simultaneously to arrays that can capture tens and eventually hundreds, as in Fig 4A–C (Litke et al., 2004; Marre et al., 2012; Segev et al., 2004). In some cases it is possible to achieve electrode densities high enough to record not just from large numbers (100+) of ganglion cells but from a large fraction of the ganglion cells in a small patch of the retina, so we can access everything that the brain “sees” about a small patch of the visual world. These sorts of experiments have become routine, in retinas from salamanders, from mice, and from primates whose visual systems are much like our own. There are efforts to scale up to recording from 1000+ cells in this way (Tsai et al., 2017)
与其在完整的大脑中研究神经元,不如将细胞培养在培养皿中,让它们连接成一个网络。大约在1980年,人们认识到可以用电极阵列对培养皿进行仪器化,从而获得这些人工网络中许多(如果不是全部)神经元的电活动(Pine 和 Gilbert,1982)。大脑大部分是三维的,因此这并不普遍适用,但视网膜至少在局部可以相当平坦。将一块解剖下来的视网膜放置在电极阵列上,可以访问将信息从眼睛传递到大脑并汇聚形成视神经的“神经节细胞”(Meister 等人,1994)。技术从同时记录少量细胞进展到可以捕获数十个甚至数百个细胞的阵列,如图4A-C所示(Litke 等人,2004;Marre 等人,2012;Segev 等人,2004)。在某些情况下,可以实现足够高的电极密度,不仅可以记录大量(100+)神经节细胞,还可以记录视网膜小块中大量神经节细胞的很大一部分,因此我们可以访问大脑“看到”的关于视觉世界小块的所有信息。这类实验已经变得很常规,使用来自蝾螈、小鼠和灵长类动物(其视觉系统与我们自己的非常相似)的视网膜。有努力通过这种方式扩展到记录1000+个细胞(Tsai 等人,2017)。
In electrode arrays, each electrode picks up signals from multiple cells and each cell appears on multiple electrodes. Thus there is a deconvolution problem, referred to as “spike sorting.” This can be solved because the spikes generated by individual neurons are stereotyped. Concretely this means that we can write the voltage $v_n(t)$ on the $n$th electrode as a sum of terms contributed by action potentials from cell $\alpha$ at times $t_{i}^{\alpha}$,
$$ v_{n}(t) = \sum_{\alpha}\sum_{i}T_{n\alpha}(t-t_{i}^{\alpha}) + \eta_{n}(t) $$
where the $T_{n\alpha}(\tau)$ are “templates” that express how cells appear at electrodes and $\eta_{n}(t)$ is residual noise (Fig 4D–F). In outline, one can learn these templates by finding candidate spike events that stand well above the background noise, clustering these, using the cluster centers as matched filters to identify more candidate spikes, and iterating. There are many challenges in turning this outline in a working algorithm; for the multielectrode arrays used in recording from the retina, see the discussions by Prentice et al. (2011) and Marre et al. (2012). An important test of spike sorting is that spikes from a single neuron should never come closer in time than a refractory period of ∼ 1 msec.
在电极阵列中,每个电极拾取来自多个细胞的信号,每个细胞出现在多个电极上。因此存在一个去卷积问题,称为“峰值排序”。这可以通过个别神经元产生的峰值是刻板化的来解决。具体来说,这意味着我们可以将第 $n$ 个电极上的电压 $v_n(t)$ 写成由细胞 $\alpha$ 在时间 $t_{i}^{\alpha}$ 处的动作电位贡献的项的总和,
$$ v_{n}(t) = \sum_{\alpha}\sum_{i}T_{n\alpha}(t-t_{i}^{\alpha}) + \eta_{n}(t) $$
其中 $T_{n\alpha}(\tau)$ 是表示细胞在电极上出现方式的“模板”,$\eta_{n}(t)$ 是残余噪声(图4D-F)。大致来说,可以通过找到明显高于背景噪声的候选峰值事件来学习这些模板,对这些事件进行聚类,使用聚类中心作为匹配滤波器来识别更多的候选峰值,并进行迭代。在将这个大纲转化为一个工作算法时存在许多挑战;对于用于记录视网膜的多电极阵列,请参阅 Prentice 等人(2011)和 Marre 等人(2012)的讨论。峰值排序的一个重要测试是来自单个神经元的峰值在时间上不应比约 1 毫秒的绝对不应期更接近。
refractory period
指神经元在一次动作电位(action potential)之后,对新的刺激暂时不再产生或不容易产生新的动作电位的时间段
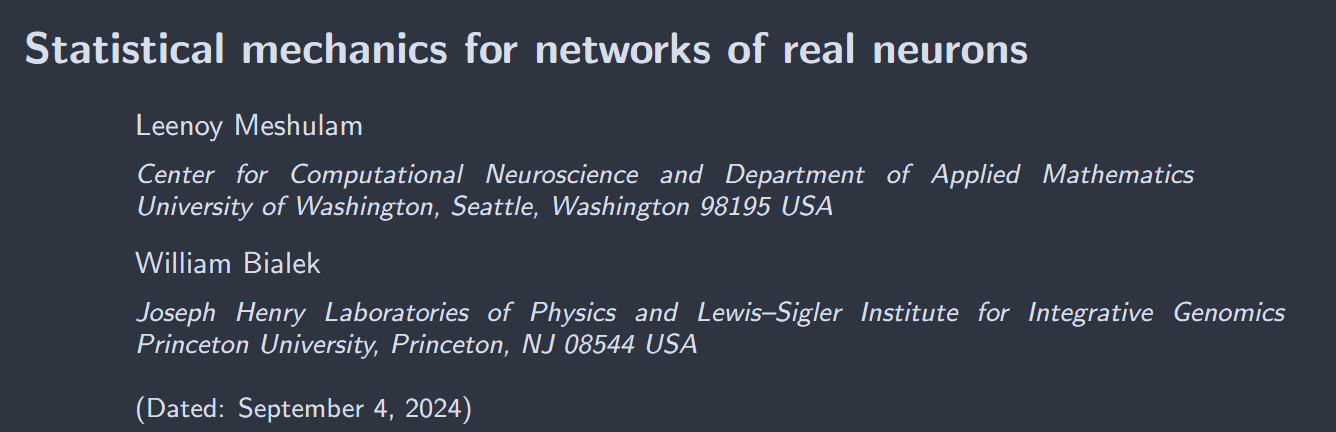
FIG. 4 Array of 252 electrodes for recording from the retina (Marre et al., 2012). (A, B, C) Views of the electrode array at increasing magnification. Distance between electrodes in 30um. (D, E) Examples of the stereotyped voltage traces—the templates $T_{n\alpha}(\tau)$ in Eq (14)—associated with two different cells. Scale bars are 6.5ms and $200\mu\text{V}$. (F) Raw voltage traces (blue) and reconstruction by superposing templates as in Eq (14). Snippets are 20 ms in duration.
图4 视网膜记录用的252电极阵列(Marre 等人,2012)。(A, B, C) 电极阵列的不同放大倍数视图。电极之间的距离为30微米。(D, E) 与两个不同细胞相关的刻板化电压轨迹的示例——方程(14)中的模板 $T_{n\alpha}(\tau)$。比例尺为6.5毫秒和200微伏。(F) 原始电压轨迹(蓝色)和通过叠加方程(14)中的模板进行重建。片段持续时间为20毫秒。
Before searching for collective behaviors in the population of neurons, experiments with multi–electrode arrays provide an efficient way of exploring the properties of many individual cells. Neurons throughout the brain can be divided into cell types, with different types exhibiting, for example, different responses to sensory inputs, different three–dimensional structures, and more recently different patterns of gene expression. The retina is a classic example, with classification based on structure dating back to the classic work of Ramon y Cajal (1893). Electrode arrays provide a direct view of how cells of a particular type tile the retina in a lattice, and how the lattices of different cell types interdigitate (Field and Chichilnisky, 2007; Roy et al., 2021). In addition to classification based on their responses to visual inputs, the templates $T_{n\alpha}(\tau)$ derived from spike sorting can be thought of as “electrical images” of each cell, and these images also aid in the classification of neural cell types (Wu et al., 2023).
在寻找神经元群体中的集体行为之前,多电极阵列的实验提供了一种有效的方法来探索许多个体细胞的特性。大脑中的神经元可以分为不同的细胞类型,不同类型表现出不同的特性,例如对感觉输入的不同反应、不同的三维结构,以及最近发现的不同基因表达模式。视网膜是一个经典的例子,其基于结构的分类可以追溯到 Ramon y Cajal(1893)的经典工作。电极阵列直接展示了特定类型细胞如何在视网膜中以晶格形式铺展,以及不同细胞类型的晶格如何交错(Field 和 Chichilnisky,2007;Roy 等人,2021)。除了基于对视觉输入的反应进行分类外,从峰值排序中得出的模板 $T_{n\alpha}(\tau)$ 还可以被视为每个细胞的“电图像”,这些图像也有助于神经细胞类型的分类(Wu 等人,2023)。
Multiple electrodes in 3D
A different approach is to insert multiple electrodes deep into brain tissue, which also has a long history. Where classical experiments brought a metal tip as close as possible to a single neuron, it was appreciated that multiple closely spaced tips, e.g. with wires twisted into a stereotrode or tetrode, could resolve multiple neurons from a small volume (McNaughton et al., 1983; Wilson and McNaughton, 1993). The introduction of methods from semiconductor fabrication made it possible to build arrays of 100 silicon needles that could be inserted into the cortex (Jones et al., 1992).
另一种方法是将多个电极插入大脑组织深处,这也有着悠久的历史。经典实验中,金属尖端尽可能接近单个神经元,但人们认识到,多个紧密间隔的尖端,例如将导线扭成立体电极或四极电极,可以从一个小体积中分辨出多个神经元(McNaughton 等人,1983;Wilson 和 McNaughton,1993)。半导体制造方法的引入使得构建可以插入皮层的100 个硅针阵列成为可能(Jones 等人,1992)。
Jumping ahead two decades, further miniaturization has led to integrated arrays of multiple electrodes along a single shaft coupled with pre–processing electronics as illustrated in Fig 5 (Jun et al., 2017). The most recent such devices have 1000+ sensors along a single probe, capable of resolving hundreds of individual neurons (Steinmetz et al., 2021). Although it is most common to deploy these arrays in studies on rodent brains, they can also be adapted to primates, where comparisons to the human brain are easier (Trautmann et al., 2023). Alternative methods make use of polymer materials for flexible electrodes (Chung et al., 2019). In particular these allow very long term recordings, monitoring the same neurons over weeks or months, e.g. as the animal learns (Zhao et al., 2023). Importantly all these methods, as with classical single neuron recordings, provide access to the full stream of action potentials generated by each neuron, down to millisecond precision.
跨越两个十年,进一步的微型化导致了沿单一轴集成多个电极阵列,并配备了预处理电子设备,如图 5 所示(Jun 等人,2017)。最新的此类设备在单个探针上具有1000多个传感器,能够分辨出数百个单独的神经元(Steinmetz 等人,2021)。虽然在啮齿动物大脑研究中部署这些阵列最为常见,但它们也可以适应灵长类动物,在那里更容易与人类大脑进行比较(Trautmann 等人,2023)。替代方法利用聚合物材料制造柔性电极(Chung 等人,2019)。特别是,这些方法允许非常长期的记录,监测同一神经元数周或数月,例如在动物学习过程中(Zhao 等人,2023)。重要的是,所有这些方法与经典的单神经元记录一样,都能访问每个神经元产生的完整动作电位流,精确到毫秒级。
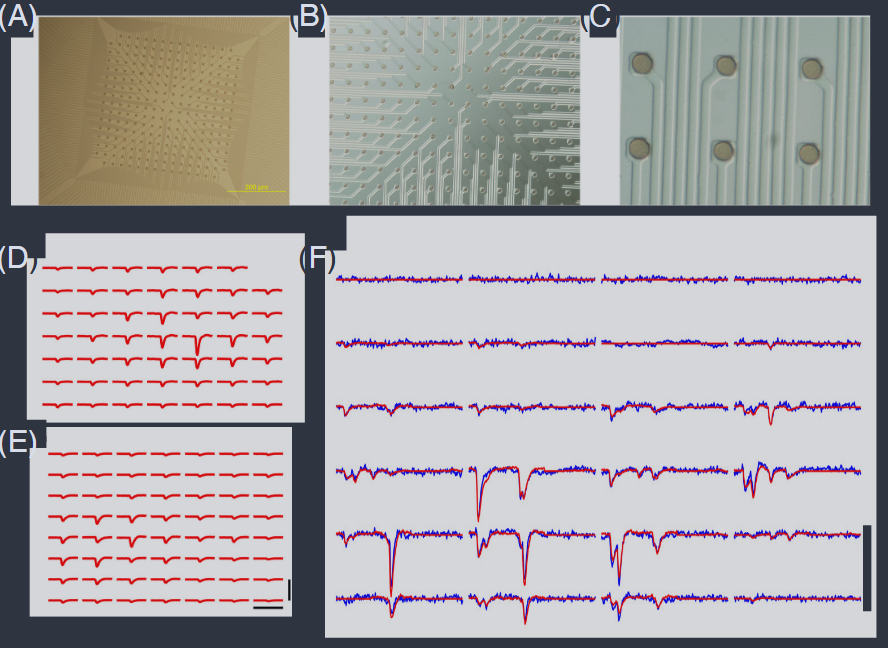
FIG. 5 The “neuropixel” probe, with 384 electrodes arrayed along a single shank (Jun et al., 2017). (A) Schematic of probe tip, showing checkerboard layout of active electrode sites. (B) Scanning electron microscope image of probe tip. (C) Probe packaging, including flexible cable and headstage electronics for data transmission. (D) Example of root–mean–square voltage noise levels in a bandwidth that captures the action potentials; $\delta V_{\text{rms}} = 5.1 \pm 0.6 \mu\text{V}$. (E) Typical site impedance in saline, measured for each site with sinusoidal 1 nA injected currents at 1 kHz; $Z = 149\pm 6\text{ k}\Omega$. (F) A short segment of raw voltage recordings in the mouse brain. Insets show the short snippets from multiple nearby electrodes that are identified as spikes from the same neuron, with 30 waveforms superposed to illustrate the stereotypy of these signals. The angle with which the shank penetrated the brain was chosen to sample many different ares; upper electrodes are in the motor cortex, lower electrodes in the dorsal tenia tecta.
图 5 “神经像素”探针,沿单一轴排列有 384 个电极(Jun 等人,2017)。(A) 探针尖端的示意图,显示了活跃电极位置的棋盘布局。(B) 探针尖端的扫描电子显微镜图像。(C) 探针包装,包括用于数据传输的柔性电缆和头部电子设备。(D) 捕捉动作电位频带内的均方根电压噪声水平示例;$\delta V_{\text{rms}} = 5.1 \pm 0.6 \mu\text{V}$。(E) 在盐水中的典型站点阻抗,通过在1 kHz下注入正弦1 nA电流测量每个站点;$Z = 149\pm 6\text{ k}\Omega$。(F) 小鼠大脑中原始电压记录的短片段。插图显示了从多个附近电极识别为同一神经元峰值的短片段,叠加了30个波形以说明这些信号的刻板性。探针进入大脑的角度选择为采样许多不同区域;上部电极位于运动皮层,下部电极位于背侧带状体。
Imaging methods
It is an old idea that we might be able to see the electrical activity of neurons, literally. The first implementation was with voltage sensitive dyes that insert into the cell membrane and have optical properties (absorption or fluorescence) that shift in response to the large electric fields associated with the action potential (Cohen and Salzberg, 1978). The exploration of the brain (and living systems more generally) was revolutionized by the discovery that there are proteins which are intrinsically fluorescent, without the need for cofactors (Johnson et al., 1962; Shimomura et al., 1962). These proteins were then tuned, by changing their amino acid sequences, to have different colors as well as fluorescence that responds to environmental signals (Tsien, 2009). Decades after their initial discovery, genetic engineering allowed the insertion of these sequences into the genome (Chalfie et al., 1994; Prasher et al., 1992), placing them under the control of regulatory elements that are active in neurons or even in restricted classes of neurons.
长期以来,人们一直认为我们可能能够直观地看到神经元的电活动。第一种实现方法是使用电压敏感染料,这些染料插入细胞膜中,其光学特性(吸收或荧光)会随着与动作电位相关的大电场而变化(Cohen 和 Salzberg,1978)。对大脑(以及更广泛的活体系统)的探索因发现存在本质上具有荧光性的蛋白质而发生了革命性变化,这些蛋白质不需要辅因子(Johnson 等人,1962;Shimomura 等人,1962)。然后通过改变它们的氨基酸序列,对这些蛋白质进行了调节,使其具有不同的颜色以及对环境信号响应的荧光(Tsien,2009)。在最初发现几十年后,基因工程允许将这些序列插入基因组中(Chalfie 等人,1994;Prasher 等人,1992),使它们受控于在神经元甚至受限类别神经元中活跃的调控元件。
Taking inspiration from voltage–sensitive dyes, the ideal would be to have a genetically encoded, fluorescent membrane protein that responds directly to the voltage across the membrane. There is continuing progress toward this goal (Abdelfattah et al., 2019; Jin et al., 2012; Platisa et al., 2023; Villette et al., 2019), but current indicator molecules are not quite sufficient for long term recordings from large populations of neurons. What we do have are fluorescent proteins that respond to changes in intracellular calcium concentration, which provides a slightly indirect, low–pass filtered trace of electrical activity; these now are widely used (Chen et al., 2013; Tian et al., 2012; Zhang et al., 2023). To make the most of these signals requires sophisticated microscopy, such as scanning two–photon methods (Helmchen and Denk, 2005). With these tools we can observed reasonably large areas of the brain with single cell resolution, as in Fig 6AC. In addition, there now are engineered proteins that insert into the membrane and act as light–gated channels, making it possible to inject controlled pulses of current it individual neurons both to excite and inhibit these cells through optical control (Packer et al., 2015; Rickgauer et al., 2014).
受到电压敏感染料的启发,理想情况下,我们希望拥有一种基因编码的荧光膜蛋白,能够直接响应跨膜电压的变化。朝着这个目标不断取得进展(Abdelfattah 等人,2019;Jin 等人,2012;Platisa 等人,2023;Villette 等人,2019),但当前的指示分子还不足以进行大规模神经元群体的长期记录。我们所拥有的是对细胞内钙浓度变化做出反应的荧光蛋白,这提供了电活动的稍微间接、低通滤波的轨迹;这些现在被广泛使用(Chen 等人,2013;Tian 等人,2012;Zhang 等人,2023)。充分利用这些信号需要复杂的显微镜技术,例如扫描双光子方法(Helmchen 和 Denk,2005)。使用这些工具,我们可以以单细胞分辨率观察大脑的相当大区域,如图 6AC 所示。此外,现在还有工程化的蛋白质可以插入膜中并充当光门控通道,使得通过光学控制向单个神经元注入受控电流脉冲以激发和抑制这些细胞成为可能(Packer 等人,2015;Rickgauer 等人,2014)。
In many regions of the brain, we do not see the full dynamical behavior of neuronal networks unless the animal is engaged in behavior. Evidently having the “sample” moving and behaving is in tension with highresolution microscopy. One solution is to miniaturize the microscope so that the animal can carry the instrument as it moves through its environment (Ziv et al., 2013; Zong et al., 2017). Alternatively one can hold the animal’s head fixed under a stationary microscope but allow it to run on rotating ball, using the movement of the ball to compute how the animal would have moved through the environment. This computed trajectory is then used to generate virtual reality (Dombeck et al., 2010; Harvey et al., 2009); an example of a virtual reality setup is shown in Fig 16B below. It is possible to simulate not just the animal’s visual experience of running through the world, but even its olfactory experience (Radvansky and Dombeck, 2018).
在大脑的许多区域,除非动物参与行为,否则我们无法看到神经元网络的完整动态行为。显然,让“样本”移动和表现与高分辨率显微镜存在矛盾。一种解决方案是将显微镜微型化,使动物能够携带仪器在其环境中移动(Ziv 等人,2013;Zong 等人,2017)。或者,可以将动物的头部固定在一个固定的显微镜下,但允许它在旋转球上奔跑,利用球的运动来计算动物将如何在环境中移动。然后使用计算出的轨迹来生成虚拟现实(Dombeck 等人,2010;Harvey 等人,2009);下面的图 16B 显示了一个虚拟现实设置的示例。不仅可以模拟动物在世界中奔跑时的视觉体验,甚至还可以模拟其嗅觉体验(Radvansky 和 Dombeck,2018)。
Imaging methods allow flexible tradeoffs among spatial resolution, temporal resolution, the area over which one records, and the signal–to–noise ratio for each individual cell. Importantly, as seen in Figs 6D and 16C, there is a regime in which the transient periods of neural activity stand out well above the background noise of the measurements from individual cells. If the aim is to record simultaneously from as many neurons as possible, one can reach “every neuron in the brain” of smaller animals, such as larval zebrafish, at the expense of visiting each neuron rather infrequently (Ahrens et al., 2013). More generally it is possible to combine methods, providing single cell recordings at high time resolution while monitoring a much larger area of the brain at lower resolution (Barson et al., 2020).
成像方法允许在空间分辨率、时间分辨率、记录区域以及每个单独细胞的信噪比之间进行灵活的权衡。重要的是,如图 6D 和 16C 所示,在神经活动的瞬态时期明显高于来自单个细胞测量的背景噪声的情况下存在一个区域。如果目标是同时记录尽可能多的神经元,可以以相对较少访问每个神经元为代价,达到记录较小动物(如幼年斑马鱼)“大脑中每个神经元”的目的(Ahrens 等人,2013)。更一般地说,可以结合使用多种方法,在监测大脑更大区域的同时,以较低分辨率提供高时间分辨率的单细胞记录(Barson 等人,2020)。
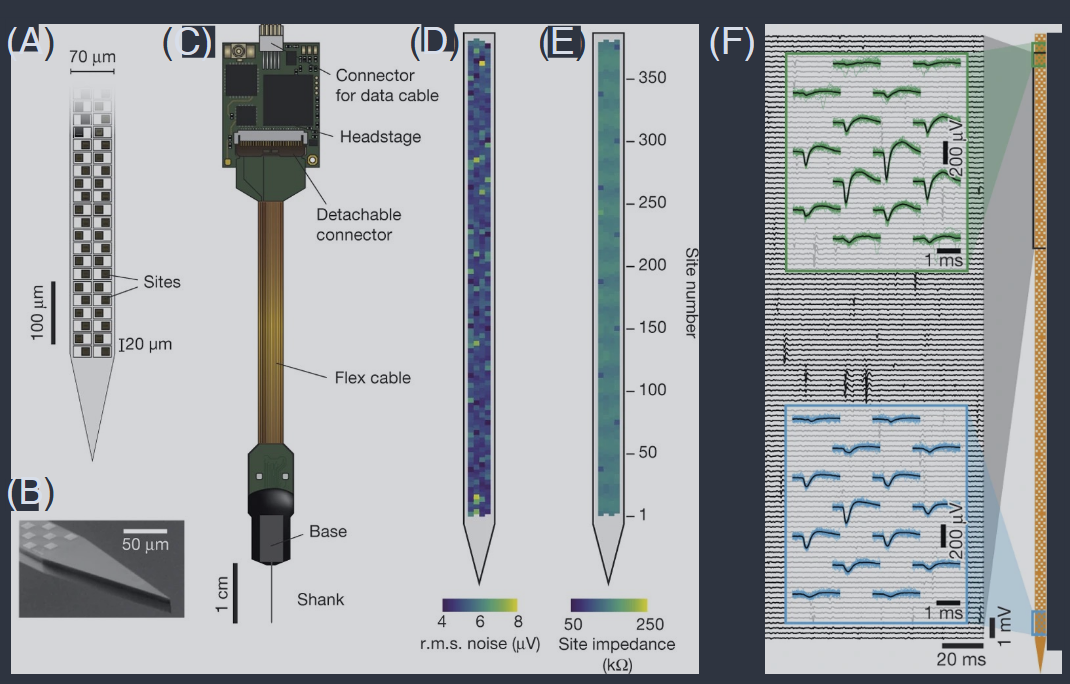
Large scale imaging of neural activity. (A) Schematic of the dorsal surface of the mouse cortex. The overlaid circle corresponds to the field of view when imaging with via the “mesoscope” setup (5 mm radius). (B) Mesoscope image from a mouse brain expressing the fluorescent calcium indicator protein GCaMP6f. (C) Four fields of view (indicated in B), with regions of interest (orange) drawn manually around individual neurons. (D) Normalized fluorescence activity traces for 16 neurons extracted from the four regions in (B). Sampling rate 9.6 Hz. (E) An example field of view for volumetric imaging via Light Beads Microscopy, which recently enabled monitoring ∼ 106 neurons simultaneously. The fast pulse structure of the laser source is used to produce “beads” (red dots) at different depths across 0.5 mm, and this then is scanned laterally, enabling volumetric recording. (F) The standard deviation of fluorescence in an imaging plane 183 μm below the cortical surface in a mouse brain expressing GCaMP6f. Panels (A–D) adapted from Sofroniew et al. (2016), (E, F) from Manley et al. (2024).
大规模神经活动成像。(A) 小鼠大脑皮层背面示意图。叠加的圆圈对应于通过“中视场显微镜”设置成像时的视野(半径5毫米)。(B) 来自表达荧光钙指示蛋白 GCaMP6f 的小鼠大脑的中视场显微镜图像。(C) 四个视野(在 B 中指示),手动在单个神经元周围绘制感兴趣区域(橙色)。(D) 从 (B) 中的四个区域提取的 16 个神经元的归一化荧光活动轨迹。采样率9.6 Hz。(E) 通过光珠显微镜进行体积成像的示例视野,最近实现了同时监测约 106 个神经元。激光源的快速脉冲结构用于在0.5毫米的不同深度产生“珠子”(红点),然后横向扫描,实现体积记录。(F) 在小鼠大脑皮层表面下183微米处成像平面的荧光标准偏差,表达 GCaMP6f 蛋白。(A-D) 改编自 Sofroniew 等人(2016),(E, F) 来自 Manley 等人(2024)。
A special case is the small worm Caenorhabditis elegans, which has only 302 neurons in total; as in many invertebrates these neurons have names and numbers and thus are identifiable across individuals. C. elegans was the first organism in which the pattern of synaptic connectivity was traced at electron microscope resolution (White et al., 1986), and this “connectome” has been revisited with modern methods (Cook et al., 2019; Varshney et al., 2011). The worm is largely transparent, so that optical methods can be used directly to monitor and drive neural activity without dissection, even in freely moving worms (Leifer et al., 2011). Recordings from 100+ neurons in this system reflect a macroscopic fraction of all the neurons, so that we are approaching “whole brain” imaging with single cell resolution (Nguyen et al., 2016b). The neurons in C. elegans do not generate the discrete, stereotyped action potentials that are familiar in other organisms, so the graded fluorescence signals in imaging experiments are a more direct correlate of slower, continuous electrical dynamics. Advances in experimental technique make it possible to identify neurons as their activity is monitored, placing them in the context of the known connectivity, and the combination of recording and stimulation has resulted “pump–probe” measurements that map the functional connections between 10,000+ pairs of cells (Randi et al., 2023). These data provide the opportunity to formulate and test more global theoretical ideas about network dynamics.
一个特殊的例子是小虫--秀丽隐杆线虫(Caenorhabditis elegans),它总共有 302 个神经元;与许多无脊椎动物一样,这些神经元有名称和编号,因此可以在个体之间识别。C. elegans 是第一个在电子显微镜分辨率下追踪突触连接模式的生物体(White 等人,1986),并且这种“连接组”已经通过现代方法重新审视(Cook 等人,2019;Varshney 等人,2011)。这种线虫大部分是透明的,因此可以直接使用光学方法来监测和驱动神经活动,而无需解剖,即使是在自由移动的线虫中(Leifer 等人,2011)。在该系统中记录的100多个神经元反映了所有神经元的宏观部分,因此我们正在接近以单细胞分辨率进行“全脑”成像(Nguyen 等人,2016b)。C. elegans 中的神经元不会产生其他生物体中熟悉的离散、刻板化的动作电位,因此成像实验中的渐变荧光信号更直接地反映了较慢、连续的电动态。实验技术的进步使得在监测其活动时识别神经元成为可能,将它们置于已知连接性的背景中,记录和刺激的结合产生了“泵-探针”测量,映射了10,000多个细胞对之间的功能连接(Randi 等人,2023)。这些数据为制定和测试有关网络动态的更全球性的理论思想提供了机会。
If we want to visit each neuron often enough to make full use of the time resolution allowed by the calcium response of the fluorescent proteins, then there will be limits on the number of neurons that can be monitored. Scanning in two dimensions one can now reach 1000+ neurons, as in the example discussed at length in §§V and VII. Scanning in depth poses additional challenges (Weisenburger et al., 2019; Zhang et al., 2021), but new “light bead” methods make use of the very short time scale of laser pulses to collect from multiple depths almost simultaneously, as shown in Figs 6E and F (Demas et al., 2021; Manley et al., 2024). These methods are pushing toward monitoring one million cells.
如果我们想足够频繁地访问每个神经元,以充分利用荧光蛋白钙响应所允许的时间分辨率,那么监测的神经元数量将会受到限制。在二维扫描中,现在可以达到1000多个神经元,如§§V和VII中详细讨论的示例所示。深度扫描提出了额外的挑战(Weisenburger 等人,2019;Zhang 等人,2021),但新的“光珠”方法利用激光脉冲的非常短的时间尺度,几乎同时从多个深度收集数据,如图 6E 和 F 所示(Demas 等人,2021;Manley 等人,2024)。这些方法正在推动监测一百万个细胞的目标。
The raw data from an imaging experiment is a movie: fluorescence intensity vs time in each of ∼ 106 pixels. What we want are signals labelled by the cells that generate them, not by pixels. This involves two essential steps: discarding all changes in light intensity that result from sources other than electrical activity (primarily motion of the brain), and grouping together the pixels that belong to each cell. In many cases these steps need to be done in three dimensions, combining signals from a “z–stack” in which the microscope’s plane of focus has been stepped through the thickness of the brain region under study. These are challenging problems in data analysis, and a wide range of mathematical and algorithmic ideas have been brought to bear: local correlations (Smith and H ̈ausser, 2010), dictionary learning (Pachitariu et al., 2013), graph-cut related algorithms (Kaifosh et al., 2014), independent component analysis (Mukamel et al., 2009), and nonnegative matrix factorization (Maruyama et al., 2014).
成像实验的原始数据就像一部电影:每个约 106 个像素的荧光强度随时间变化。我们想要的是由产生它们的细胞标记的信号,而不是由像素标记的信号。这涉及两个基本步骤:丢弃所有由电活动以外的来源引起的光强度变化(主要是大脑运动),并将属于每个细胞的像素分组。在许多情况下,这些步骤需要在三维中完成,结合来自“z堆栈”的信号,其中显微镜的焦平面已经穿过所研究的大脑区域的厚度。这些都是数据分析中的挑战性问题,已经采用了广泛的数学和算法思想:局部相关性(Smith 和 H ̈ausser,2010)、字典学习(Pachitariu 等人,2013)、图割相关算法(Kaifosh 等人,2014)、独立成分分析(Mukamel 等人,2009)和非负矩阵分解(Maruyama 等人,2014)。
The fact that neurons generate discrete action potentials means that if we look in small time bins the natural variables are binary, inviting a connection to Ising models. Calcium–sensitive indicators do not give us direct access to the time resolution that is needed for this binary description. There are several efforts to reconstruct the ∼ msec spikes that underlie the ∼ 100 msec calcium signals, but we suspect that these will be overtaken by advances in engineering directly voltage–sensitive proteins. An alternative, which we use below, is to discretize the calcium signals, admitting that the resulting binary variables necessarily refer to “active” and “inactive” states of the cell rather than to the presence or absence of action potentials (Fig 16C).
神经元产生离散动作电位的事实意味着如果我们在小时间段内观察,天然变量是二进制的,这引发了与伊辛模型的联系。钙敏感指示剂并不能直接提供进行这种二进制描述所需的时间分辨率。有几种努力试图重建支撑约 100 毫秒钙信号的约毫秒级峰值,但我们怀疑这些努力将被直接电压敏感蛋白质的工程进步所超越。另一种选择是我们下面使用的方法,即对钙信号进行离散化,承认由此产生的二进制变量必然指的是细胞的“活跃”和“不活跃”状态,而不是动作电位的存在或不存在(图16C)。
Perspective
Experimental methods for monitoring the electrical activity of neurons continue to evolve rapidly. It is interesting to look ahead, and make some predictions about where the methods will be in five or ten years. Again we caution that we are theorists surveying the state of experiments.
监测神经元电活动的实验方法仍在迅速发展。展望未来,预测这些方法在五年或十年内的发展方向是很有趣的。同样,我们要提醒大家,我们是理论家,在审视实验的现状。
In recordings based on electrodes and electrode arrays we can expect two major trends. The first is better coverage and higher sampling density. It is tempting to focus on the largest scale experiments as these are perhaps the most tantalizing opportunities to test the applicability of statistical physics ideas. In practice, however, more neurons often come at the expense of lower sampling density, which matters deeply for comparison with theory (e.g. §V.C), so one would like to be careful. We expect that the push for “whole brain” coverage soon will by complemented by a push for denser sampling: instead of choosing between high density sampling in a small region, often in 2D, or sparse sampling of much larger areas in 3D, experiments will get much closer to recording every neuron in progressively larger volumes. The second trend is toward longer duration recordings, with chronic presence of electrodes in the animal brain. Recent efforts have provided proof of concept for recordings that last for weeks; we expect this to become more routine, reaching toward experiments that last months or even years. The central challenge is verifying that we are monitoring the exact same set of cells throughout the entire recording. The big advantage, of course, is that the animal can be monitored in its home cage, in different environments, at different times of the day, as it engages in a fuller range of behaviors. The longest time scale recordings will give a unique view of neural dynamics during learning.
基于电极和电极阵列的记录可以预期有两个主要趋势。第一个是更好的覆盖范围和更高的采样密度。专注于最大规模的实验是很诱人的,因为这些实验可能是测试统计物理学思想适用性的最诱人机会。然而,在实践中,更多的神经元通常以较低的采样密度为代价,这对于与理论的比较非常重要(例如§V.C),因此需要谨慎。我们预计对“全脑”覆盖的推动很快将与对更密集采样的推动相辅相成:实验将越来越接近在逐渐增大的体积中记录每个神经元,而不是在小区域内进行高密度采样(通常是二维)或在三维中稀疏采样更大区域之间进行选择。第二个趋势是朝着更长时间的记录发展,在动物大脑中长期存在电极。最近的努力已经为持续数周的记录提供了概念验证;我们预计这将变得更加常规,达到持续数月甚至数年的实验。当然,最大的优势是可以在动物的家笼中、在不同环境中、在一天中的不同时间监测它,同时让它参与更全面的行为范围。最长时间尺度的记录将为学习过程中的神经动态提供独特的视角。
On the optical front, the growth in number of neurons that we can (literally) see simultaneously has recently accelerated dramatically, as seen clearly in Fig 3. Faster, more selective scanning is in the works, which should allow more imaging techniques to reach the realm of ∼ 106 neurons, with improved signal–to–noise ratio. Currently, when imaging $10^5$ − $10^6$ neurons, the loss of temporal resolution is significant, with a drop to acquisition rates below 10 Hz. As with electrodes where sampling density in space matters, here it is the sampling density in time that can be problematic. There are tradeoffs among speed, number of neurons, the signalto–noise ratio in each neuron, and total amount of optical power delivered to the brain, but these are specific to each imaging modality and we can hope for progress. Another intriguing direction is selective acquisition; following methods used in astrophysics, if we can concentrate on the exact locations of the neurons, we can scan more quickly and use the same number of photons more efficiently. Additionally, there is steady improvement in methods to express both indicators and light–gated channels in the same cells, often targeting specific classes of cells. This will bring to larger animals the kind of complete survey of functional connectivity that currently is possible only in C. elegans (Randi et al., 2023), as well as making it possible to probe causal connections between neural activity and motor output.
在光学方面,我们可以同时(字面上)看到的神经元数量的增长最近显著加速,如图 3 所示。正在开发更快、更选择性的扫描方法,这应该允许更多的成像技术达到约 106 个神经元的范围,并提高信噪比。目前,在成像 $10^5$ - $10^6$ 个神经元时,时间分辨率的损失是显著的,采集速率降至低于 10 Hz。与电极中空间采样密度重要一样,这里时间采样密度可能是一个问题。在速度、神经元数量、每个神经元的信噪比以及传递到大脑的总光功率之间存在权衡,但这些权衡是特定于每种成像方式的,我们可以期待进步。另一个有趣的方向是选择性采集;借鉴天文学中使用的方法,如果我们能够集中在神经元的确切位置,我们可以更快地扫描并更有效地使用相同数量的光子。此外,在同一细胞中表达指示剂和光门控通道的方法也在稳步改进,通常针对特定类别的细胞。这将使较大的动物能够进行目前仅在 C. elegans 中可能实现的功能连接性的完整调查(Randi 等人,2023),并使探测神经活动与运动输出之间的因果关系成为可能。
Finally, a significant breakthrough would be if voltagesensitive fluorescent proteins become fully viable. The demands are severe: proteins must respond on a millisecond time scale, with large amplitude changes in fluorescence, and cells must be programmed to insert these proteins into the membrane. When this happens, it will become possible to monitor thousands to millions of neurons with a resolution where we see every individual action potential, giving us the precision of electrodes and the survey capacity of optical imaging.
最后,一个重大突破将是电压敏感荧光蛋白变得完全可行。要求非常严格:蛋白质必须在毫秒时间尺度上响应,荧光变化幅度大,并且必须对细胞进行编程以将这些蛋白质插入膜中。当这一点实现时,将有可能以分辨率监测数千到数百万个神经元,在这里我们可以看到每个单独的动作电位,从而获得电极的精度和光学成像的调查能力。